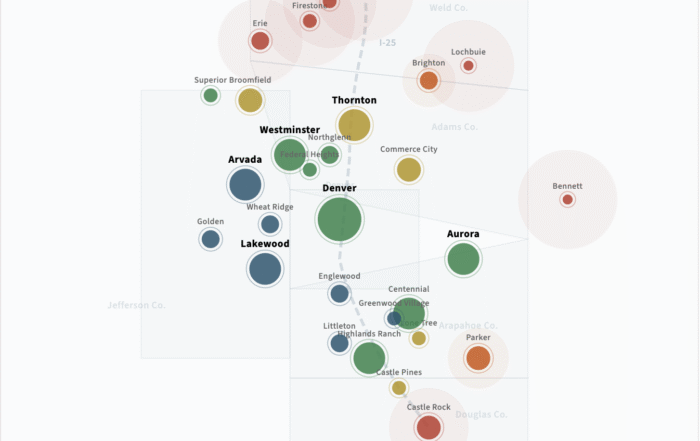
Metro Denver Population Growth
Projected 10-year population growth by municipality across the Denver–Aurora–Lakewood MSA, extending north through the Carbon Valley corridor to Dacono. Data synthesized from U.S. Census Bureau estimates (2024), Colorado State Demography Office (DOLA) projections, and DRCOG regional forecasts.
+2.8% since 2020 Census
DOLA / DRCOG forecast baseline
County-Level Growth (2024 → 2035 Proj.)
Douglas and Weld Counties are capturing the bulk of net new residents, driven by master-planned communities and relative affordability. Adams County benefits from I-25 corridor infill, while Jefferson County remains largely built-out with minimal organic growth.
Projections by Growth Corridor
10-year growth projections by city/town, informed by historical CAGR, active residential permits, planned developments, and DRCOG land use allocations.
Projections blend Colorado State Demography Office (DOLA) county-level forecasts with municipal-level growth rates derived from Census PEP 2020–2024 vintages. High-growth communities (Erie, Parker, Castle Rock, Dacono, Frederick) reflect active master-plan development pipelines and building permit data. Mature/built-out cities (Lakewood, Wheat Ridge, Englewood) are projected at reduced rates reflecting infill-only growth. Carbon Valley corridor projections account for announced residential developments along the I-25/SH-52/SH-66 corridors. International immigration is assumed to continue at 2022–2024 rates (~14,000/yr metro-wide). The 28–33 age demographic bulge identified by the State Demographer supports continued natural population increase through 2053. Jefferson County school closures and aging suburban demographics are factored as headwinds in western metro projections.